


Last Updated: November 4, 2026
Quick Summary
To reduce EDR alert fatigue, clear obvious noise in bulk, sort remaining alerts by asset criticality and behavior, and validate context before escalating. Then tune rule conditions, thresholds and scope instead of silencing alert names, and track alerts per endpoint and false-positive rate against a baseline.
- EDR alert fatigue is the decline in spotting real threats after prolonged exposure to low-value alerts.
- Triage in bulk first, then rank by asset criticality and read the behavior, not the label.
- Tune the rule condition before threshold or scope changes to preserve detection on other assets.
- Record every exclusion in a tuning register with an owner, scope and expiry date.
- Watch the escalation ratio: if it drops to zero, you stopped escalating, not stopped noise.
Table of Contents
- Why EDR Alert Volume Overwhelms Small Security Teams
- A Step-by-Step EDR Alert Triage Process
- EDR False Positives: Find the Pattern Before You Silence It
- EDR Alert Tuning Best Practices That Keep Coverage Intact
- How Managed EDR Monitoring Changes the Workload
- Metrics That Prove Alert Fatigue Is Actually Falling
- Protecting Analysts From Burnout While You Fix the Queue
- Common Mistakes That Make Alert Noise Worse
- Request an EDR Assessment for Your Team
- Frequently Asked Questions
Why EDR Alert Volume Overwhelms Small Security Teams
Endpoint detection and response tools are built to catch everything. That is the problem. A single endpoint can generate hundreds of alerts in a week, and most small teams have one or two people watching that queue on top of their day jobs. When the queue never empties, attention frays, and the alerts that matter start to look like the ones that don’t.
This guide walks through how to reduce EDR alert fatigue without cutting coverage. Below, you will find the triage process, the tuning habits, and the metrics that tell you whether noise is actually falling.
EDR alert fatigue is the decline in an analyst’s ability to spot real threats after prolonged exposure to high volumes of low-value alerts. It is not a tool problem alone. It is a workload and process problem.
What alert fatigue actually costs you
The cost shows up in three places, and none of them appear on a dashboard.
- Slow response to real incidents. A genuine threat sits behind forty routine alerts. By the time someone opens it, the damage window has widened.
- Silenced rules. Frustrated analysts disable detections to get relief. Coverage quietly shrinks.
- Staff turnover. The person who knows your environment best leaves because the job feels pointless.
A common mistake is treating alert volume as proof the tool is working. Volume is not coverage. A noisy queue often hides weaker detection than a quiet, well-tuned one.
A Step-by-Step EDR Alert Triage Process
Triage is the practice of deciding, quickly and consistently, which alerts deserve action now, which need more context, and which can be closed. A repeatable process beats individual judgment, especially when the person on duty changes.
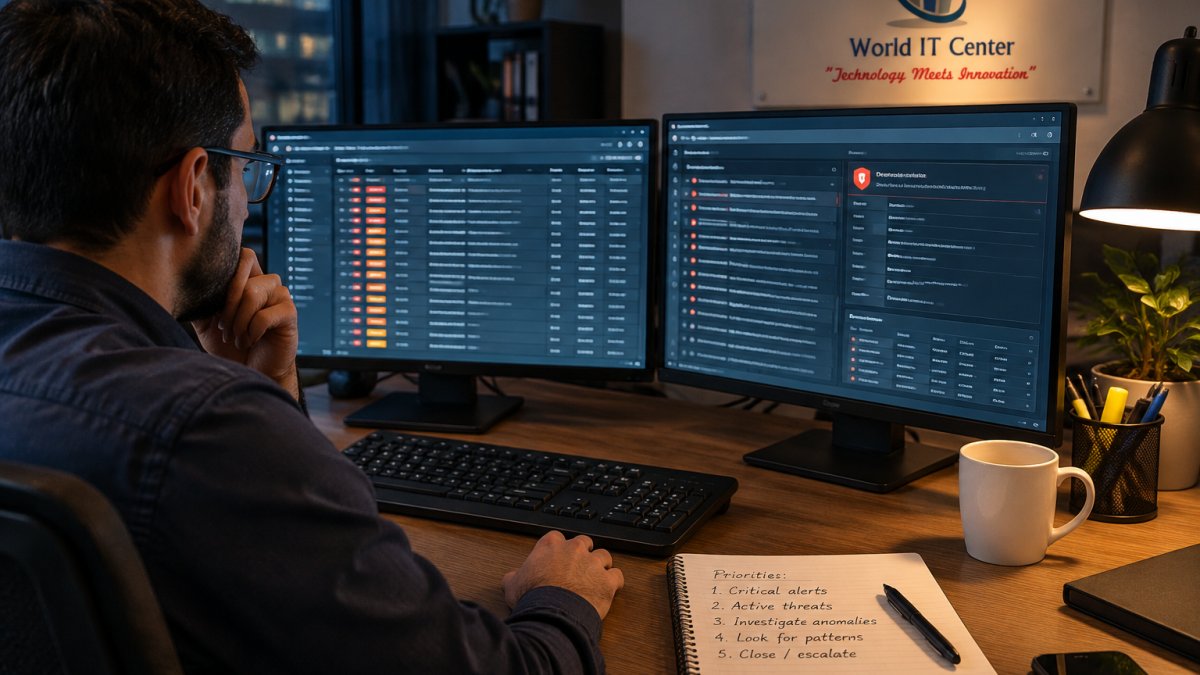
Here is a process that suits a small team:
- Clear the obvious noise first. Close alerts from known-good tools and approved admin activity. Do this in bulk, not one by one.
- Sort what remains by asset criticality. A domain controller outranks a loaner laptop every time.
- Read the behavior, not the label. Ask what the process actually did, not what the alert name says.
- Validate before escalating. Pull the surrounding context: parent process, user, time, network destination.
- Escalate or close with a note. Every close gets a reason so the next analyst does not re-investigate.
- Log the pattern. If the same alert closes the same way five times, it belongs in tuning, not triage.
Step 1: Sort by asset criticality and behavior
Start with the machines that would hurt most if compromised. Servers, finance workstations, and anything holding customer data come first. Then look at what the process did.
A signed update tool writing to its own folder is boring. The same tool spawning a command shell is not. Rank by asset, then confirm by behavior.
Step 2: Validate before you escalate
Validation means gathering enough context to make a call. Check the parent process, the user account, the time of day, and the destination. If the story holds together, close it. If it doesn’t, escalate.
For teams that want deeper background on judging whether an alert is genuinely malicious, advanced threat protection for Windows covers the detection layers behind these signals. Watch out: escalating without context wastes the responder’s time and trains the team to ignore escalations.
EDR False Positives: Find the Pattern Before You Silence It
An EDR false positive is an alert triggered by legitimate activity that the detection logic misreads as malicious. Silencing a single false positive is easy. Silencing the pattern behind it is what actually reduces noise.
Before you disable anything, group the alerts. Look for:
- The same process name across many machines
- The same user or service account
- The same time window, such as a nightly backup
- The same destination or file path
Once you see the pattern, you can write a narrow exception instead of a broad one. A rule that excludes one signed binary on one server path is safe. A rule that ignores an entire detection category is not.
A common mistake is silencing by alert name alone. That hides the symptom and leaves the cause running. If you want concrete tactics for cutting volume without losing coverage, seven ways BullZIGA cuts security alert noise walks through the approach we use.
EDR Alert Tuning Best Practices That Keep Coverage Intact
Tuning is the ongoing work of adjusting detection rules, thresholds, and exclusions so the tool reports what matters in your environment. Good tuning raises the signal-to-noise ratio. Bad tuning lowers your security posture. The difference between the two is almost never effort, it is whether you tune with a framework or by instinct.
Most small teams tune reactively: an alert annoys someone, so they silence it. That pattern produces a stack of undocumented exclusions and a queue that looks quieter while coverage quietly erodes. A detection-engineering mindset replaces that with a repeatable loop: measure the rule, decide whether the logic or the environment is wrong, change one variable, and verify the change against real telemetry.
Tune the rule logic, not the alert name
Every detection rule has three parts you can adjust: the condition (what behavior it matches), the threshold (how often or how many before it fires), and the scope (which assets or users it applies to). Silencing by alert name touches none of these, it just hides output. Real tuning changes one of the three.
- Condition tuning. If a rule fires on a signed updater spawning a child process, narrow the condition to exclude that specific parent-child pair rather than the whole process family.
- Threshold tuning. A rule that fires on five failed logons in a minute may be right for a server and wrong for a shared workstation. Set thresholds from your own baseline telemetry, not vendor defaults.
- Scope tuning. Exclude a rule from a known-benign asset group (a build server, a kiosk) instead of disabling it fleet-wide.
A common pattern is to tune the condition first, because it preserves detection on other assets. Threshold and scope changes are broader and should be the second and third options, not the first.
Build a tuning register, not a pile of exclusions
Every exclusion is a small, permanent decision about what you will not see. Treat it like one. A tuning register, a simple spreadsheet or ticket queue, records the rule ID, the change made, the reason, who approved it, the asset scope, and an expiry date for review.
This matters more than it sounds. Undocumented exclusions become permanent blind spots because nobody remembers why they exist, and nobody dares remove them. A register with expiry dates forces a periodic re-decision: does this exclusion still earn its place, or has the environment changed?
Watch out: an exclusion approved for a temporary project (a migration, a new deployment tool) will outlive the project unless it carries an expiry date. Most noise regressions trace back to exclusions that were correct once and never revisited.
Test in a pilot ring before the fleet
Roll every tuning change to a small pilot group first, a handful of representative endpoints, not the whole fleet. Compare alert volume and false-positive rate on the pilot ring against the fleet baseline for a defined window before promoting the change. This catches the two failure modes that matter: a change that kills real detections, and a change that does not actually reduce noise.
Keep a rollback path. Every exclusion should be reversible in minutes, which means the change is documented well enough that someone other than its author can undo it.
Review cadence and rule refinement
Set a fixed review. Monthly works for most small teams. Weekly is better if you are actively fighting noise. In each review, pull the top ten noisiest rules, check how many fired, and decide whether each one earned its place. Pair that with the metrics below so tuning is judged by outcomes, not by how quiet the queue feels.
Rule refinement is not a one-time project. Environments change, new software arrives, and yesterday’s good threshold becomes today’s noise source. Treat tuning as a standing task with an owner and a cadence, and tie each change to a metric so you can prove the work is paying off.
Measure tuning against a baseline
Tuning without measurement is guesswork. Before you change anything, capture a baseline: alerts per endpoint per week, false-positive rate, and the top ten noisiest rules by volume. After each tuning cycle, re-measure the same numbers. A change that lowers volume but raises the false-positive rate has not helped, it has moved the problem.
The most useful tuning metric is the alert-to-incident ratio: how many alerts it takes to surface one genuine incident. A falling ratio means tuning is working. A flat ratio despite falling volume usually means you are silencing noise without improving detection quality, which is the failure mode most tuning programs fall into.
For teams that want to see how a managed service applies this loop continuously, seven ways BullZIGA cuts security alert noise walks through the approach we use, and BullZIGA Managed EDR for 10 devices shows what the managed endpoint detection and response service covers.
How Managed EDR Monitoring Changes the Workload
Managed EDR monitoring can move the triage, tuning, and escalation work to a dedicated team. Your staff can keep visibility and approval authority, and the queue need not remain a second job.
In general, a managed provider can watch the security operations center around the clock, correlate alerts across endpoints, and escalate only what needs a decision. The goal is higher-fidelity alerts instead of raw telemetry.
For teams weighing the cost of that shift, managed security pricing models compared for SMBs lays out the common structures before you commit. If you want to see the offering itself, BullZIGA Managed EDR for 10 devices shows what the managed endpoint detection and response service covers.
The handoff design matters. A managed service only reduces workload if the escalation rules match your business. Agree on what counts as urgent before any engagement starts, not after the first noisy month.
Metrics That Prove Alert Fatigue Is Actually Falling
You cannot manage noise you do not measure. Track a small set of numbers and review them on the same cadence as your tuning.
| Metric | What it tells you | Healthy direction |
|---|---|---|
| Alerts per endpoint per week | Raw volume | Falling |
| False positive rate | Share of alerts closed as benign | Falling |
| Mean time to respond | Speed from alert to first action | Falling |
| Escalation ratio | Share of alerts that reach a human decision | Falling, but not to zero |
| Reopened alerts | Alerts closed too early | Falling |
| Analyst hours on triage | Time cost of the queue | Falling |
The escalation ratio is the one to watch closely. If it drops to zero, you have stopped escalating, not stopped noise. A healthy ratio means real threats still reach a person.
Pair these with a simple analyst survey each quarter. Ask how often the queue felt unmanageable. The number is subjective, but it catches burnout before turnover does.
Protecting Analysts From Burnout While You Fix the Queue
Burnout is a security risk, not a morale issue. A tired analyst misses context, closes alerts too fast, and stops asking questions. Fixing the queue takes time, so protect the people in it while you work. Most guides treat this as a wellness footnote, a reminder to take breaks. That undersells it. Alert fatigue is a workload problem with a psychological cost, and the teams that handle it well treat burnout as an operational metric, not a personality trait.
Recognize the early signals before turnover
Burnout rarely announces itself as burnout. It shows up first as small behavioral changes that are easy to miss in a small team:
- Faster closes with thinner notes. An analyst who once documented context starts closing alerts with a single word. That is not efficiency, it is disengagement.
- Rising reopened-alert rate. Alerts closed too early get reopened when the next person looks. A climbing reopen rate is an early burnout signal hiding in your metrics.
- Queue avoidance. Triage duty gets deferred, traded, or quietly skipped. The person who used to clear the queue first now clears it last.
- Cynicism about escalations. “Nothing we escalate ever matters” is a burnout statement, not a security judgment, and it precedes the moment an analyst stops escalating real threats.
Watch out: the analyst most at risk is often the most reliable one, because reliable people absorb the queue without complaint until they leave. Track the signals, not the complaints.
Separate the queue from the person
A small team cannot rotate triage across a large staff, so the structural fixes matter more. Cap continuous queue time, no one should sit in the queue for a full shift if it can be avoided, and a mid-shift handoff restores attention even when the queue is short. Give analysts closure authority so they can resolve an alert with a documented note instead of parking it for approval. Trust is a workload reducer: an analyst who can close moves faster and feels ownership instead of helplessness.
Celebrate good closes. A well-documented false-positive close is a win, not a non-event, it is the work that keeps the queue honest. When the team sees the noise trend falling because of their tuning, the work feels like progress instead of an endless treadmill.
Make burnout measurable
You cannot manage what you do not measure, and this applies to the human side as much as the technical. Pair the queue metrics with a short quarterly check-in: ask how often the queue felt unmanageable, how often triage was deferred, and whether the team feels the noise is trending down. The answers are subjective, but they catch burnout before turnover does, and they give you a trend line to compare against your tuning work.
A useful pattern is to review the human signals on the same cadence as the tuning review. If alert volume is falling but the team still reports the queue as unmanageable, the tuning is not reaching the work that actually burdens people, usually the escalation path or the documentation burden, not the raw alert count.
Recovery, not just prevention
Prevention keeps a fresh team from burning out. Recovery is what you do when someone is already there. The most effective recovery move in a small team is to remove the person from the queue entirely for a defined period, not a lighter load, a real break, and redistribute triage with explicit coverage so the break does not create guilt. Pair that with a review of what made the queue unmanageable in the first place, because returning someone to the same conditions is how burnout becomes a cycle.
For distributed teams, reliable endpoint security for remote work covers how to keep coverage steady when analysts and endpoints are spread across locations, which matters because remote triage removes the informal breaks an office provides.
Teams that reduce alert fatigue sustainably treat the analyst as part of the system being tuned. A process that burns out the people running it will fail no matter how well it is designed.
Common Mistakes That Make Alert Noise Worse
Most noise problems are self-inflicted. These are the mistakes we see most often.
- Buying another tool to fix a process problem. More detections on top of an untuned stack means more noise.
- Silencing by category. Broad exclusions shrink coverage and hide real threats.
- Skipping documentation. Undocumented exclusions become permanent blind spots.
- No review cadence. Rules drift and nobody notices until the queue is unmanageable again.
- Ignoring the human side. A process that burns out analysts will fail no matter how well it is designed.
The fix is rarely a bigger stack. It is a tighter process, a tuning habit, and a clear escalation path.
Request an EDR Assessment for Your Team
If your queue never empties, the problem is solvable. Start with one week of logging: count alerts per endpoint, note the top five noisiest rules, and time how long triage takes. That baseline tells you where to tune first.
Software, MSP, Antivirus, Consulting Services offers managed endpoint protection that includes BullZIGA Endpoint Security and Managed EDR, and provides licensing and deployment support for Microsoft environments. Ask our team how these services would apply to your environment.
Get started by requesting an EDR assessment from Software, MSP, Antivirus, Consulting Services to see where your alert volume is coming from.
Frequently Asked Questions
How do you reduce alert fatigue in an EDR console?
Start by measuring the problem: count alerts per day, how many are closed as benign, and how long analysts spend on each. Then work through three layers in order. First, fix triage so high-risk signals get looked at before low-risk noise. Second, investigate EDR false positives by pattern rather than muting them one at a time. Third, apply EDR alert tuning best practices such as threshold adjustment and rule refinement on a scheduled review cycle. Each layer cuts volume without removing detection coverage, which is the whole point of reducing EDR alert fatigue.
What are the main causes of high EDR alert volumes?
Most volume comes from a handful of sources: default detection rules shipped at maximum sensitivity, legitimate admin tools and scripts flagged as suspicious behavior, duplicate alerts for the same event across multiple sensors, and missing context that forces an analyst to investigate everything manually. Environments with unmanaged or poorly inventoried endpoints also generate more noise, because the console cannot tell a sanctioned tool from an intruder’s. Fixing inventory and context often removes more noise than changing detection rules.
Will tuning EDR rules hide real threats?
Tuning hides threats only when it is done by silencing alerts instead of understanding them. The safer approach is to scope exclusions narrowly: exclude a specific signed binary on a specific host group rather than disabling a detection category. Keep a written record of every change and its reason, and review exclusions on a schedule so they do not accumulate. If you cannot explain why an alert fired, investigate it before you touch the rule. Managed EDR monitoring providers typically maintain this change log as part of the service.
Can managed EDR monitoring help a small team?
It can, mainly by moving first-pass triage off your staff. With managed EDR monitoring, a provider can watch the console, validate alerts against context, and escalate only the ones that need action on your side. That changes the job from reviewing every alert to responding to a short list. For teams without a dedicated security operations center, this is often the difference between an EDR tool that gets used and one that gets ignored. Ask any provider exactly what they triage, what they escalate, and how fast.
